
Sponsored By: 42 Agency
Scale your B2B SaaS Brand with 42 Agency. 42 Agency is your plug and play demand-get and revenue ops team—used by used by ProfitWell, Cin7, SproutSocial, Guru, Smile.io, and dozens of other companies that are looking to scale.
Let’s say you just launched a product to a group of users for the first time. (I’m speaking purely hypothetically, of course 😉.) Launch went pretty well: good signups, hearty praise, and some promising early data. Or maybe you’re not sure how well it went.
Now what?
In the movies, what happens next is a montage where you work tirelessly day and night—on what, exactly, it’s not clear—and all the graphs go up and to the right, until you find yourself in the conference room of a law firm in Palo Alto with some partner telling you to that a $65 million settlement with the Winklevoss twins is just a “speeding ticket,” because that’s how rich you are.
In real life you have to do things to make the graph go up and to the right. Often it’s not exactly clear what to do.
You can think of the post-launch phase of a startup as one big optimization problem. You have a bunch of goals—engagement, retention, growth—and a lot of levers you can pull to achieve them. The challenge is figuring out which goals you should focus on, and which levers actually work.
The good news is that there are some frameworks you can use to think through this problem. Many founders before you have been in the same spot. I’m interested in this because it’s what I’m going currently through with Lex. But I hope it’s helpful for anyone else in a similar situation.
Retention: leaky until proven sticky
Most products do not retain users. Therefore, you should assume yours doesn’t, until the data conclusively proves otherwise.
This doesn’t mean you should get sad about it or worry, but it does mean it should be your top priority. In order to grow a business, almost no matter what type of business you have, you’re going to need regular usage.
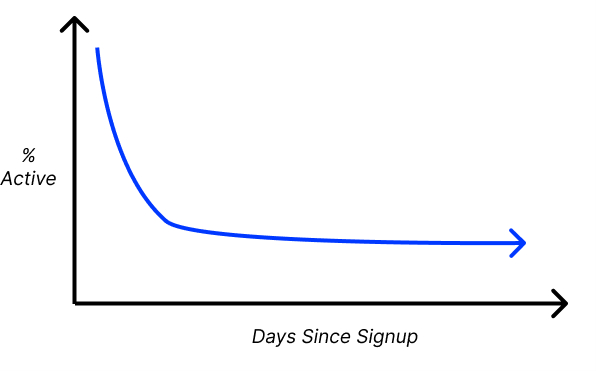
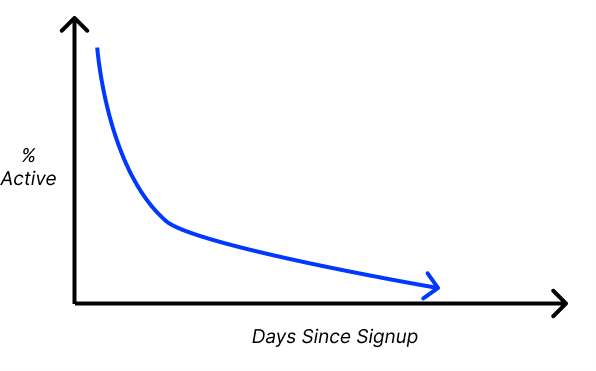
After your product has had people using it for a week or so, create a retention analysis and find out how many people are still using the product seven days later. Don’t worry too much about the percentage yet—higher is obviously better, but what matters most is whether anyone cares enough to continue using it. You’re looking for a line that seems to go flat at some point, rather than following a gradual slope toward zero:
Basically you want this:
Not this:
To create a graph like this, I recommend using Amplitude to track all the core actions that users take in your product. (This is not an ad; they just have the best product.)
I have a few Amplitude tips that I had to figure out the hard way. (This might be getting a bit in the weeds for some of you, but it’s useful to know.) There are many different ways to look at retention, and it took me a while to figure out what they mean.
- N-day retention means, for each day, what percentage of users came back on that exact day. You can use strict calendar dates or 24-hour windows custom to each user that start on the moment they signed up (good for normalizing time zones).
- Unbounded retention means, for each day, what percentage of users came back on that day or at any later date. So if a user came back on day 4, even if they weren’t around on days 2-3, they would still appear as “retained” on those days.
The Only Subscription
You Need to
Stay at the
Edge of AI
The essential toolkit for those shaping the future
"This might be the best value you
can get from an AI subscription."
- Jay S.
Join 100,000+ leaders, builders, and innovators

Email address
Already have an account? Sign in
What is included in a subscription?
Daily insights from AI pioneers + early access to powerful AI tools


 Front-row access to the future of AI
 Bundle of AI software

 Evan Armstrong
 Dan Shipper
Comments
Don't have an account? Sign up!